
 Bitcoin: Percent Addresses in Profit
Zoom in with touchscreen: Touch and hold with ONE finger then drag.
Zoom in on desktop: Left click and drag.
Reset: Double click.
What is This Chart Showing?
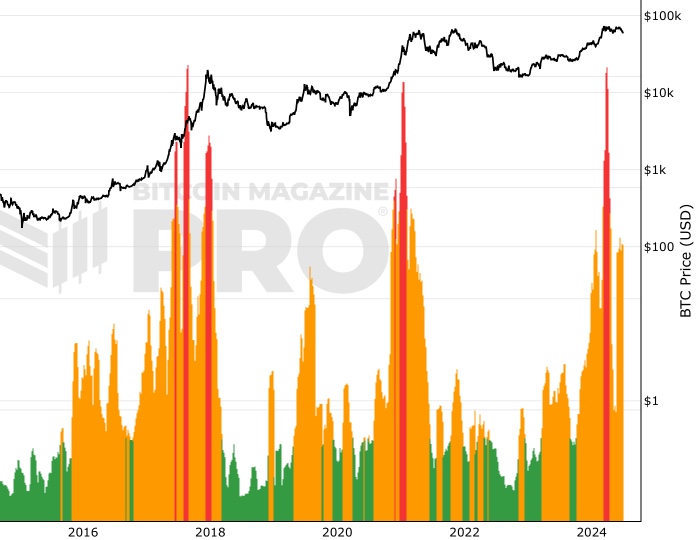
This chart shows the proportion of distinct addresses holding bitcoin where the average purchase price is beneath the current market value.
"Purchase price" refers to the price of Bitcoin at the moment bitcoins were moved into an address.
It is the inverse chart of Percent Addresses in Loss.
Why is this chart useful?
It can be useful to track market sentiment over time as it is able to show the extent to which the general market is holding onto bitcoin at a profit, or at a loss.
You May Also Be Interested In
Value Days Destroyed (VDD) Multiple
Identifies Bitcoin cycle highs by comparing near-term spending velocity with yearly average of spending velocity.
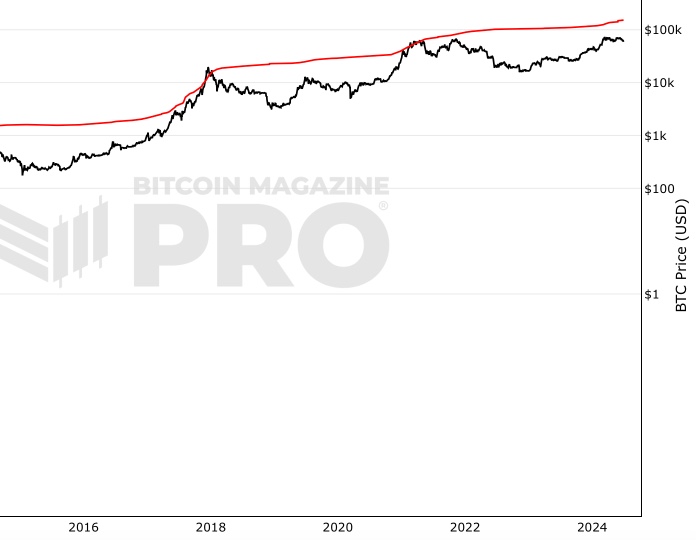
Terminal Price
Pricing model for identifying Bitcoin bull market highs.
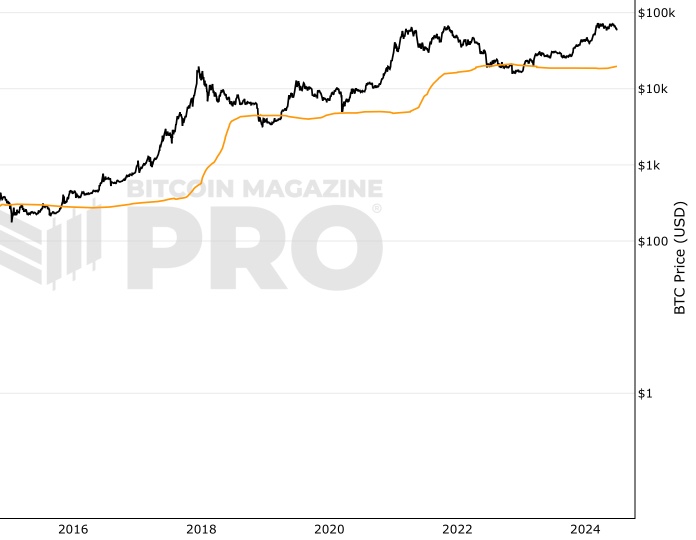
Long-Term Holder Realized Price
Average price at which long-term investors have purchased their Bitcoin.
Make smarter decisions about Bitcoin. Instantly.
Access the Bitcoin and Global Macro Charts that really drive Bitcoin’s price.
+40 chart alerts. Never miss critical levels on charts again.
Analysis newsletter. Manage your emotions at market extremes.
Private Tradingview indicators. See Bitcoin chart levels in real time!
Cancel anytime.
Any information on this site is not to be considered as financial advice. Please review the Disclaimer section for more information.