
 Bitcoin: Bitcoin Cycle Master
Zoom in with touchscreen: Touch and hold with ONE finger then drag.
Zoom in on desktop: Left click and drag.
Reset: Double click.
Indicator Overview
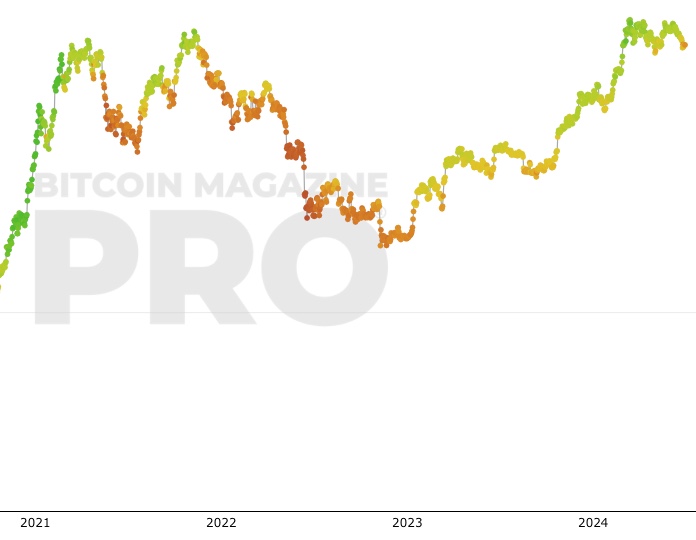
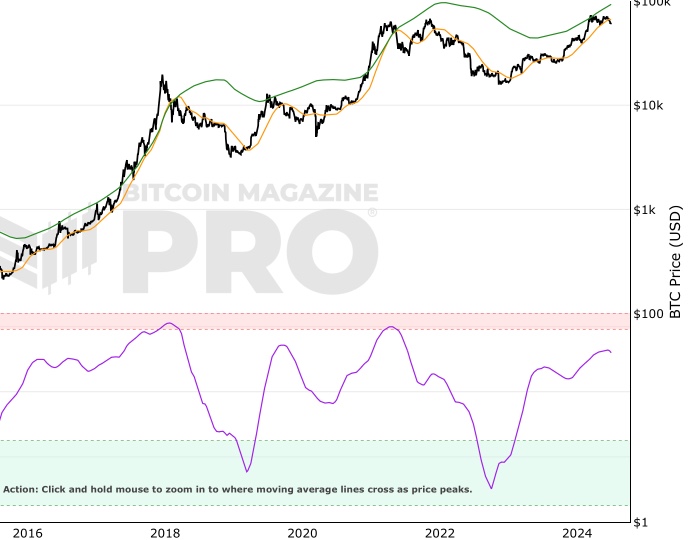
Bitcoin Cycle Master is a combination of on-chain metrics including Coin Value Days Destroyed and Terminal Price. They are able to identify where Bitcoin price is valued relatively within its cycles. Historically those cycles have been approximately every 4 years and correlate with Bitcoin Halving events. There is no guarantee that will continue to be the case in the future, and the metrics that make up Bitcoin Cycle Master track actual economic behavior on the Bitcoin blockchain.
Bitcoin Cycle Master can identify periods of increased risk when transaction behavior on-chain is indicative of major cycle highs. It also identifies areas of value opportunity where on-chain transaction behavior signals major cycle lows.
You May Also Be Interested In
Fear And Greed Index
Market sentiment tool gauging investor fear and greed over time.
Pi Cycle Top & Bottom Indicator
Pi Cycle Top and Bottom Indicator.
Bitcoin Profitable Days
The proportion of days in Bitcoin's traded history that it has been profitable to hold Bitcoin
Make smarter decisions about Bitcoin. Instantly.
Access the Bitcoin and Global Macro Charts that really drive Bitcoin’s price.
+40 chart alerts. Never miss critical levels on charts again.
Analysis newsletter. Manage your emotions at market extremes.
Private Tradingview indicators. See Bitcoin chart levels in real time!
Cancel anytime.
Any information on this site is not to be considered as financial advice. Please review the Disclaimer section for more information.